Monthly Archives: February 2022

By Jim Shorey

PM2.5 is Particulate Matter smaller than 2.5 microns in size.

Particulate Matter such as wood smoke is often measured using the principle of Beta Radiation Attenuation and Nephelometer Light Scattering Detection.

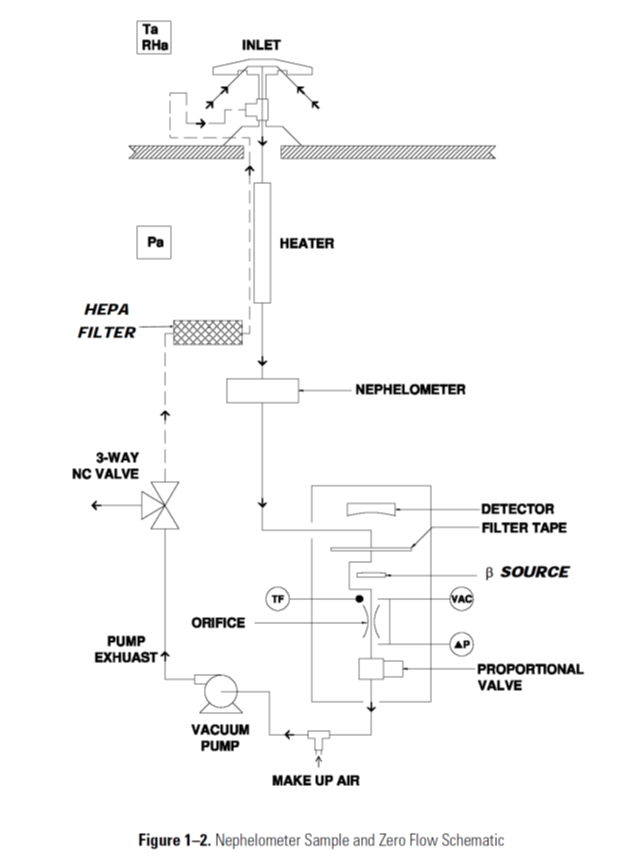
Looking at the flow diagram below, particulate is drawn into the Inlet via a vacuum pump.  The Inlet has a PM10 Impactor combined with a PM2.5 Cyclone, to reduce the particulate size down to PM2.5.  The Nephelometer assembly senses the light scattered by the particulate passing through an 880 nanometer illumination light beam. The nephelometry response is linear with particulate concentration in micrograms per cubic meter. Afterwards, the particulate matter is deposited onto a glass fiber filter tape. The filter tape will accumulate a particulate sample towards a threshold value, where the filter tape will automatically advance prior to reaching saturation. During the collection of particulate onto the detector filter tape, the Monitor uses the radiometric principle of beta radiation attenuation through a known sample area to continuously collect and detect the deposited particulate.

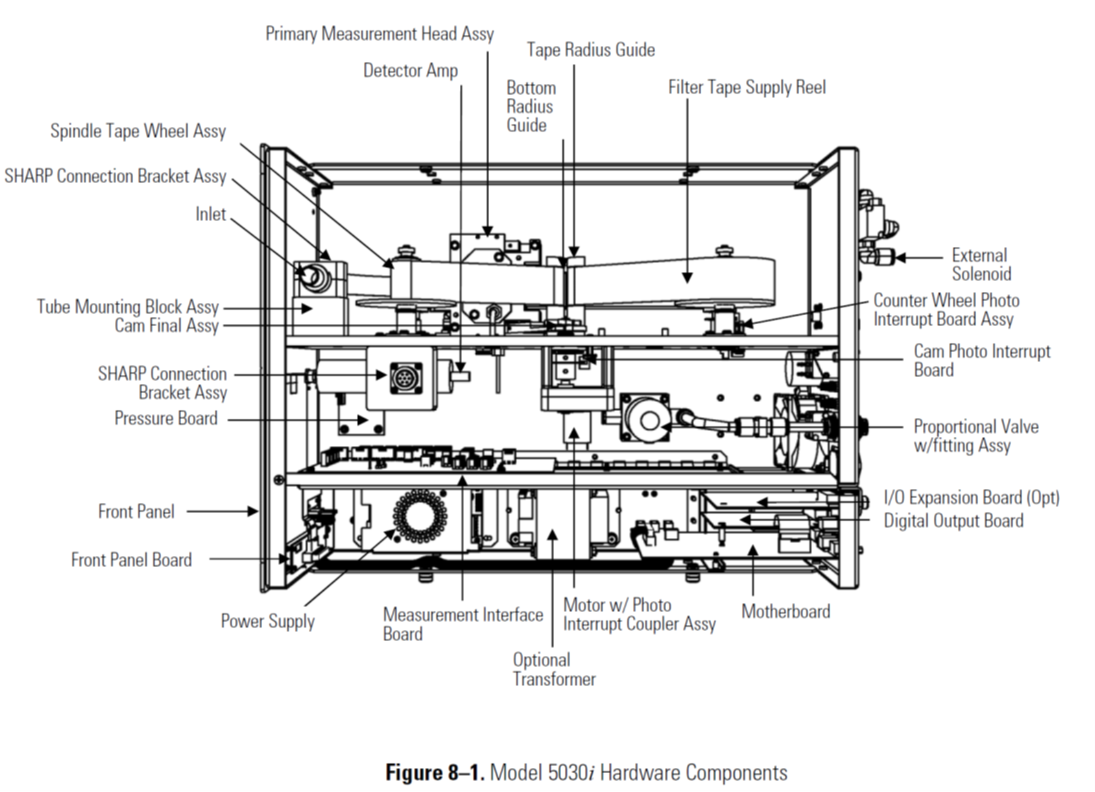
Particulate Analyzer Component Layout

Ozone Jim Shorey Ozone gas is commonly measured by instruments with UV Photometric Technology Looking at the Flow Schematic shown below in Figure 1-2, we see the layout of an Ozone Analyzer. This unit includes an internal Air Sample Pump, which draws Ambient Air into the port labeled SAMPLE. Once the sample enters the sample… Continue Reading

NO-NO2-NOx Jim Shorey NO-NO2-NOx gases are commonly measured by instruments using Chemiluminescence. Looking at the Flow Schematic shown below in Figure 1-2, we see the layout of a NOx Analyzer. This unit includes an internal Air Sample Pump, which draws Ambient Air into the port labeled as SAMPLE.  The next component shown as REACTION CHAMBER… Continue Reading

Hydrogen Sulfide, H2S Jim Shorey H2S gas is commonly measured by instruments using both UV fluorescence and a Heated Converter. Hydrogen Sulfide, H2S gas emissions are often a result from oil & gas production facilities. Looking at the Flow Schematic shown below in Figure 1-2, we see the layout of an H2S Analyzer. This unit… Continue Reading

Sulphur Dioxide, SO2 Jim Shorey SO2 gas is commonly measured by instruments using Ultra Violet UV fluorescence. Looking at the Flow Schematic shown below in Figure 1-2, we see the layout of an SO2 Analyzer. This unit includes an internal Air Sample Pump, which draws Ambient Air into the port labeled as SAMPLE. The next… Continue Reading

Technology behind the Data – Total Hydrocarbon Jim Shorey Hydrocarbon gas is commonly measured by instruments with a Flame Ionization Detector Looking at the schematic shown below in Figure 1-1, we see a basic diagram of a Flame Ionization Detector.  The FID detector requires both Air and Hydrogen to mix and be lit into a… Continue Reading

Technology behind the Data – Carbon Monoxide, CO By: Jim Shorey CO gas is commonly measured by instruments using Gas Filter Correlation GFC. Looking at the Flow Schematic shown below in Figure 1-2, we see the layout of a CO Analyzer. This unit includes an internal Air Sample Pump, which draws Ambient Air into the… Continue Reading

For over a decade Lafarge Canada Inc. (Lafarge) has been a part of a Western Canada wide anti-idling campaign. This campaign occurred across all of Lafarge’s operations and included not only Lafarge employees but contractors working on behalf of Lafarge. The purpose of the campaign was to recognize that air quality is everyone’s responsibility and… Continue Reading